···
Sign in
···
···
rstats
hashtag
About
Reviews
Updates
1
Followers
0
Experts
Experts
snippets
· 19
algoswithamber
· 7
timbulwidodostp
· 2
mrchillph
· 52
Posts
Threads
algoswithamber
4 months ago
PeakD
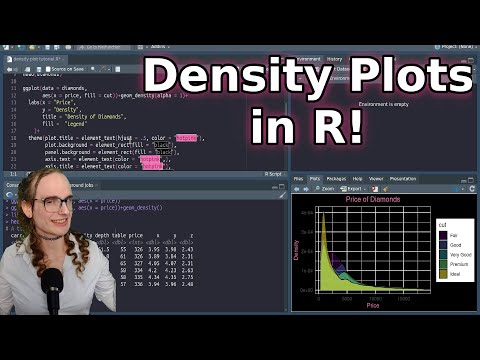
Density Plot Tutorial in R
Hey everyone, I wanted to share this density plot tutorial that I recently created. I also provided sample code that you can use to follo...
algoswithamber
6 months ago
PeakD
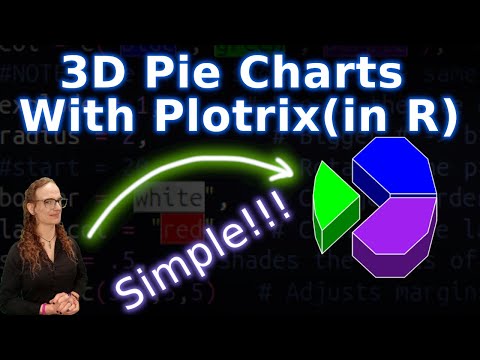
3D Pie Chart in One Line of Code?
As I have demonstrated in the previous tutorials, it is definitely possible to make a pie chart using the ggplot package in the R program...
algoswithamber
6 months ago
PeakD
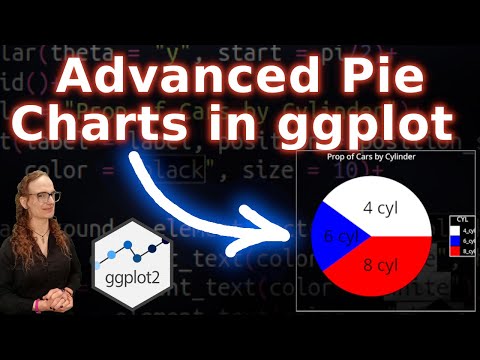
Advanced Pie Chart Customization in R - ggplot Tutorial 12
Hey everyone, and welcome back. In today's video, we're going to be doing some advanced pie chart customization. In a previous post, I sh...
algoswithamber
6 months ago
PeakD
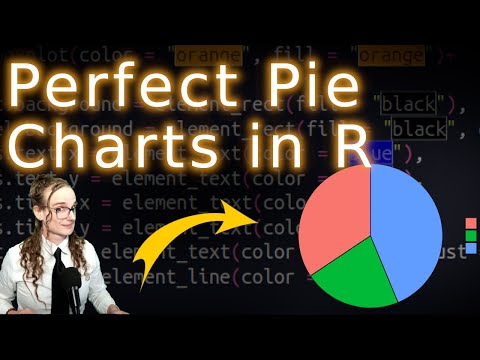
Perfecting Pie Charts in R🥧- ggplot Tutorial 11
Do you want to know something funny? The R programming language and the ggplot package are some of the most powerful data visualization s...
algoswithamber
6 months ago
PeakD
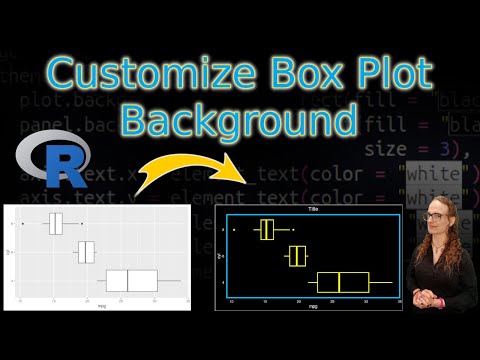
Customizing Box Plot Panel Background - ggplot Tutorial 10
Hey everyone, and welcome back to the final tutorial in the series on customizing box plots using the R programming language. So far we h...
algoswithamber
6 months ago
PeakD
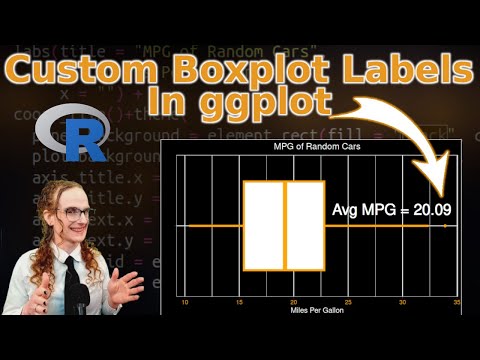
Adding Custom Labels on Box Plots - ggplot Tutorial 9
Suppose you just created a beautiful box plot in the R programming language, but now you want to add the mean, the median, or some other ...
algoswithamber
6 months ago
PeakD
Harmonization of GDP Growth Rates After NAFTA/CUSMA
I used the R programming language to make this graph, which illustrates how the GDP growth rates of the United States, Canada, and Mexico...
algoswithamber
6 months ago
PeakD
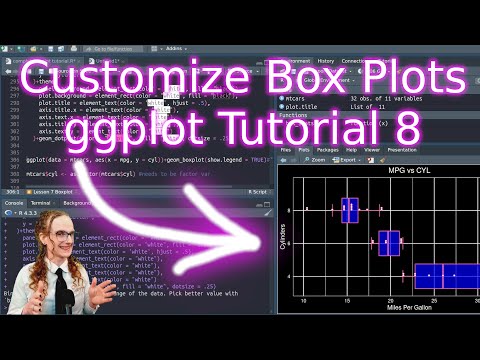
Additional Box Plot Customization Options - ggplot Tutorial 8
In a previous video, we learned how to create a basic box pot, but in today's video we are going to go over a ton of cool customization o...
algoswithamber
6 months ago
PeakD
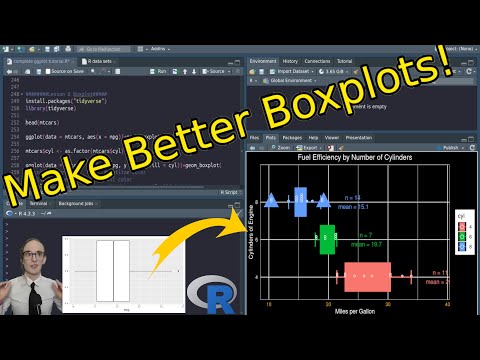
Make Better Boxplots!! - ggplot Tutorial 7
Box plots are a powerful statistical tool that graphically represent five essential characteristics of your data: the minimum value, the ...
algoswithamber
6 months ago
PeakD
Changing Plot Backgrounds in R - ggplot Tutorial 5!
Hey, everyone! Welcome back to the fifth tutorial in our ggplot series. In a previous tutorial, I showed you how to change the scatter pl...
algoswithamber
6 months ago
PeakD
Quickly Change Plot Color Schemes With ggsci : R Tutorial 4
If you're anything like me, then you know it can be difficult to find color combinations that work well together. Thankfully, the R progr...
algoswithamber
6 months ago
PeakD
GGPLOT Tutorial 3 - Changing Label Size, Shape, Font, Rotation, and Alignment
Hey everyone and welcome back to the third tutorial in our ggplot tutorial series. In today’s post, we continue exploring how to customiz...
algoswithamber
6 months ago
PeakD
R-Programming Tutorial : Labels, Titles, and Subtitles with ggplot2
Maybe you've heard the saying that a picture is worth a thousand words, but guess what? Words themselves are pretty important also! Espec...
timbulwidodostp
9 months ago
Simulation extrapolation (Simex) Use simex With (In) R ...
... Software https://ristek.link/simex Simulation extrapolation (Simex) Use simex With STATA 19 https://ln.run/simex #rstudio #rstats #r...
timbulwidodostp
9 months ago
Maximum Likelihood Estimation for Generalized Linear Mixed Models Use mcemGLM ...
... With (In) R Software https://ristek.link/mcemGLM Maximum likelihood estimation of quadratic exponential models Use cquad (cquadbasic...
timbulwidodostp
9 months ago
Linear Regression Use lmGC (tigerstats) With (In) R ...
... Software https://ln.run/lmGC OLS Linear vs Log-Linear Functional Form Tests Use lmfreg With STATA 19 https://ristek.link/lmfreg #rst...
timbulwidodostp
9 months ago
Granger causality test (multivariate) Use granger_causality (bruceR) With (In) R ...
... Software https://ristek.link/bruceR Granger Causality Test at Higher Order AR(p) Use lmgc With STATA 19 https://ln.run/lmgc #rstudio...
timbulwidodostp
9 months ago
Poisson-Tweedie generalized linear model Use ptglm (ptmixed) With (In) R ...
... Software https://ristek.link/ptglm Within, between, and overall R-squared in linear two-level models Use twolevelr2 With STATA 19 ht...
timbulwidodostp
9 months ago
Ordered ordinal probit switching regression (OPSR) Use opsr (OPSR) With (In) R ...
... Software https://ln.run/opsr Probit Estimators with Misclassification of the Dependent Variable Use mrprobit With STATA 19 ristek.li...
timbulwidodostp
9 months ago
Jackknife variance estimates of regression coefficients Use var.jack (pls) With ...
... (In) R Software https://ln.run/varjack Test for the level of clustering Use mnwsvt With STATA 19 ristek.link/mnwsvt #rstudio #rstats...
timbulwidodostp
9 months ago
Cluster robust standard errors with degrees of freedom adjustments for ...
... lmerMod/lme objects Use robust_mixed (CR2) With (In) R Software https://ln.run/robust_mixed Standard errors robust inference with mu...
timbulwidodostp
9 months ago
Meta-regression Use metareg (meta) With (In) R ...
... Software https://dik.si/metareg Quantifying Systematic Heterogeneity in Meta-Analysis Use getmstatistic With STATA 19 https://ln.run...
timbulwidodostp
9 months ago
GMM Estimation of Panel VAR Models Use pvargmm (panelvar) With (In) R ...
... Software https://dik.si/pvargmm Panel vector autoregressive models (PVARs) Use xtvar2 With STATA 19 https://ln.run/xtvar2 #rstudio #...
timbulwidodostp
10 months ago
Meta-analysis of binary outcome data Use metabin (meta) With (In) R ...
... Software https://ln.run/metabin Fragility index for meta-analysis Use metafrag With STATA 19 ristek.link/metafrag #rstudio #rstats #...
timbulwidodostp
10 months ago
Meta-analysis of diagnostic test accuracy studies with the multiple cutoffs model ...
... Use diagmeta With (In) R Software ristek.link/diagmeta DIagnostic Meta-Analysis using the split component synthesis method Use diagm...
timbulwidodostp
10 months ago
VCOVs robust to spatial correlation, a la Conley (1999) (Conley VCOV) Use ...
... vcov_conley (fixest) With (In) R Software https://ln.run/fixest Spatial Correlation Robust Inference via SCPC Use scpc With STATA 19...
timbulwidodostp
10 months ago
Simulation Extrapolation Inverse Probability Weighted Generalized Estimating ...
... Equations Use gee (swgee) With (In) R Software ristek.link/swgee Estimation 'Logit' Estimation with Spatial Standard Errors Use xgml...
timbulwidodostp
10 months ago
Apply univariate regression models Use reg (quickReg) With (In) R ...
... Software https://ln.run/quickReg OLS Estimation with Spatial Standard Errors Use x_ols With STATA 19 https://dik.si/x_ols #rstudio #...
timbulwidodostp
10 months ago
Synthetic controls to multiple treated units Use multiple.synth (SCtools) With ...
... (In) R Software https://ln.run/SCtools Medcouple measure of asymmetry and tail heaviness Use medcouple With STATA 19 ristek.link/_me...
timbulwidodostp
10 months ago
A robust measure of skewness for univariate data Use medcouple (mrfDepth) With ...
... (In) R Software ristek.link/medcouple Utilities to automate synthetic control estimation using synth Use synth_runner With STATA 19 ...