Calling the Break-out (BTD/USD) Yes, you are getting a trading post from me...
4 comments
This morning I was trading on my favorite no-KYC site and things were dismal for buyers. But I am able to sell Bitcoin that I don' t have and then buy it back after it goes lower for a profit, that is called shorting Bitcoin and it is legal to do, so I was looking for a place to sell. But there were not highs on which to sell. The price had been dropping and bouncing off the dashed red line which I created as trading tool in order to predict a good place to buy and sell.
If I had were to sell or short the market, I would want to do that near where the price line had bounced off the top green line. To see what I am referencing, see the post I made on SimpleFX below.
%20SimpleFX%20WebTrader.png)
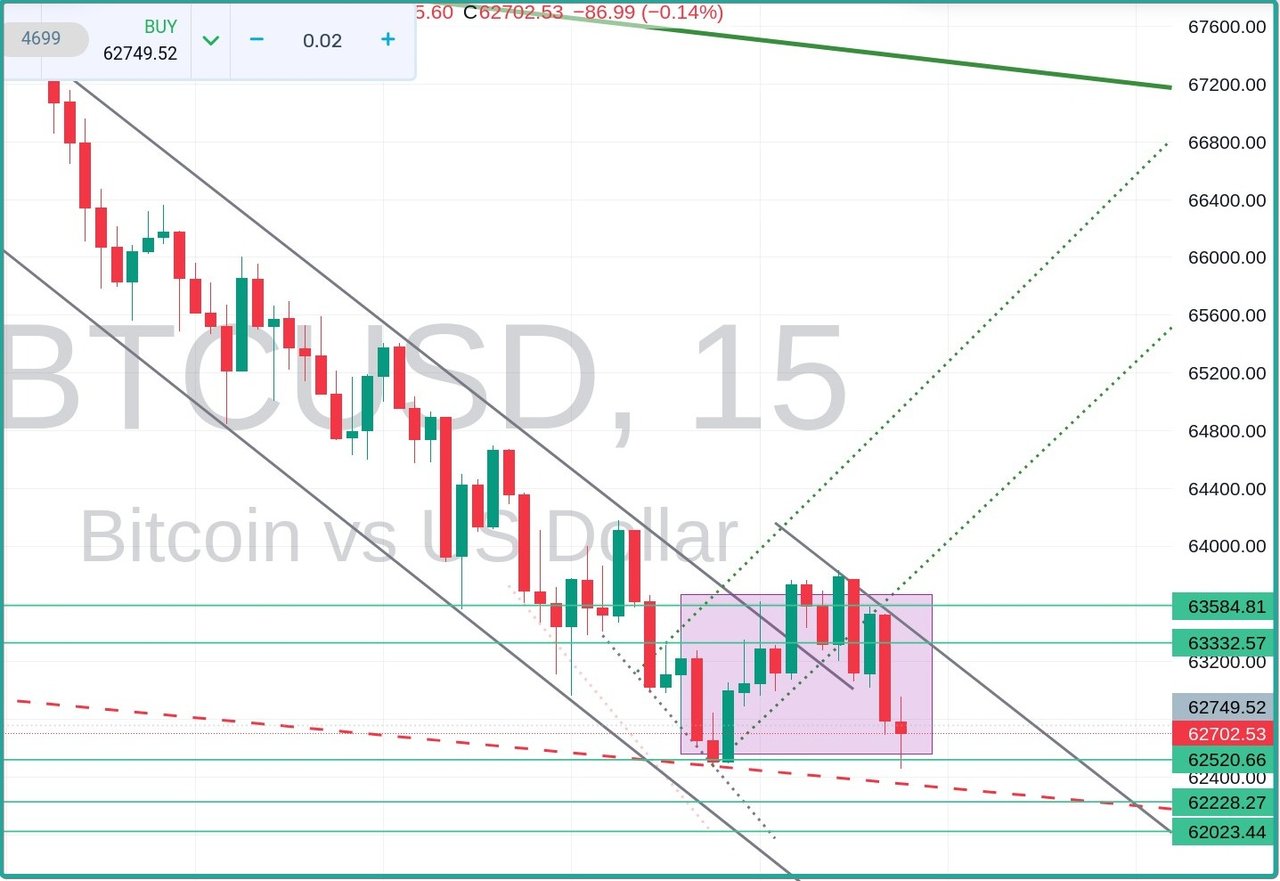
Since I was posting anyway, over there, I thought I would make one for Hive as well. This all happened ni the last few hours. It is hard to see it on the above image, but there was a trench within which Bitcoin was trading all morning. It is clearer in the image below.
%20SimpleFX%20WebTrader.png)
I was trying to buy when the price was near the bottom line because the price always when up when it hit that line, and sell when it was near the top line (the black lines are what create what I call a trench as it were). Every time I sell high and buy back lower, called a short, then I make a profit theoretically... and when I buy near the bottom line and sell when it goes up, again, a profit.
My post on SimpleFX was to alert others that there might be a breakout, where the coin stops bouncing between those two lines, and a new strategy can be employed. I am not here to buy and sell within a trench, no, I am here to get a good low price in order to hold it as it rises to the moon. But this is what God gave me to work with this morning, so I played with it.
I saw an upward trend near another line that I have been watching (the dashed red line or as I call it, the recent bottom) and I made an upward line (a dotted green one) and speculated that the price might break out rather than breaking through the recent botton which has lasted for many days. Above, you can see the price going past the upper trench line, a little bit. I called a breakout (it has stopped trading inside the trench in other words),
and made another post.
The following image shows that my breakout had occurred, but it seemed to only increase the width of the trench. This leaves us with the same problem we had when it hit a corner (seen better below). We still have the recent bottom that likely won't be broken...
I saw it moving sideways, and then downward so I created a wider trench for it to trade in. But then, the breakout occurred.
Anytime it comes near the dashed Red line which it has been bouncing off of for weeks, buy the low end near the dashed line. But I also had a couple of automatic buys set at the top of the trench in case it broke out, and it did and they bought (I am still holding those) because when you have an active buy and the price is near a line, off of which the price has been bouncing, you generally want to keep it.
Why?
The chart below explains what I am talking about and why t knew it was going up...
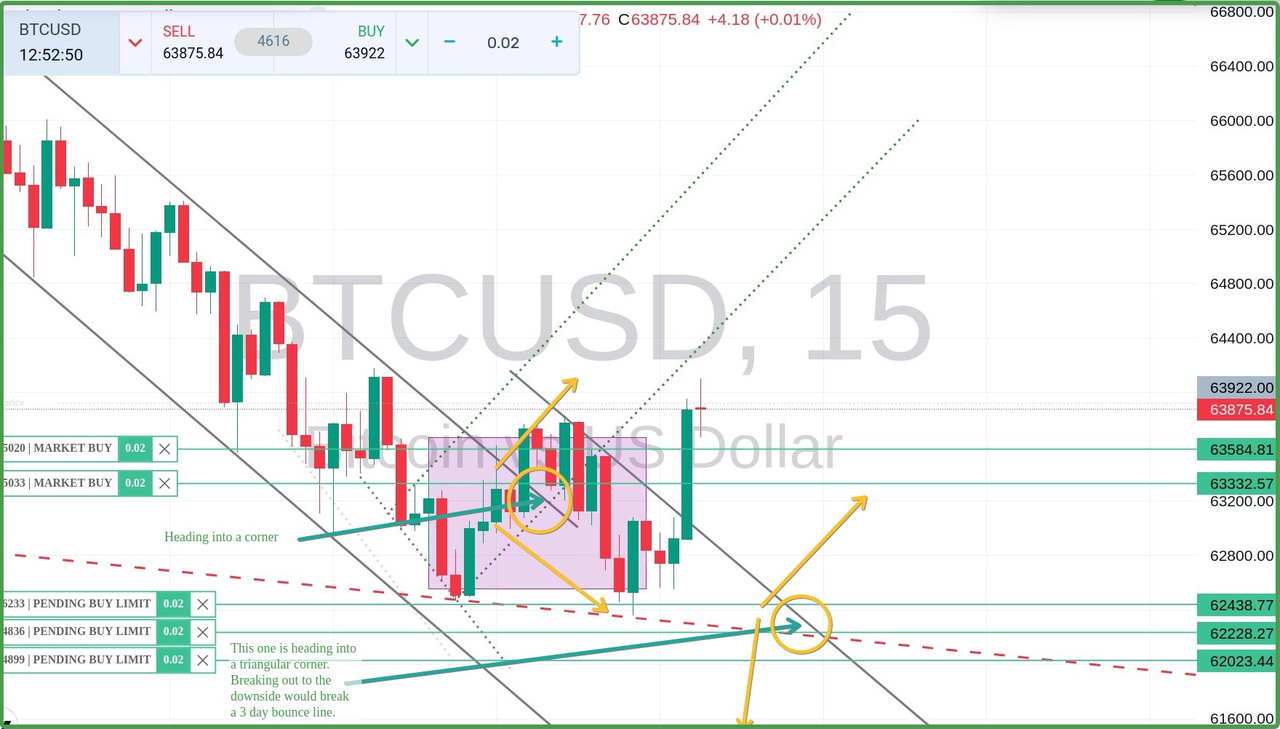
Here we have the entire scenario with some extra drawings to help you see it. In the center of the yellow circle on the left, we have the corner that the price had painted itself into. It either had to break out of the solid black line (marking the top of our trench, or it had to break through the dotted green line in order to continue trading within the trench. As it turns out, it did both (making a wider trench) and now it was heading back toward the recent trend trending "bottom" and it is heading for another corner (a triangle shaped one), the one in the right yellow circle.
The price movement either has to violate the recent trend line (the 'bottom') or it has to the upper line of our new wider trench. It cannot stay in the corner. As the price moves up and down, the red and green rods, called candles, have to move toward the right. Each candles represents fifteen minutes of time.
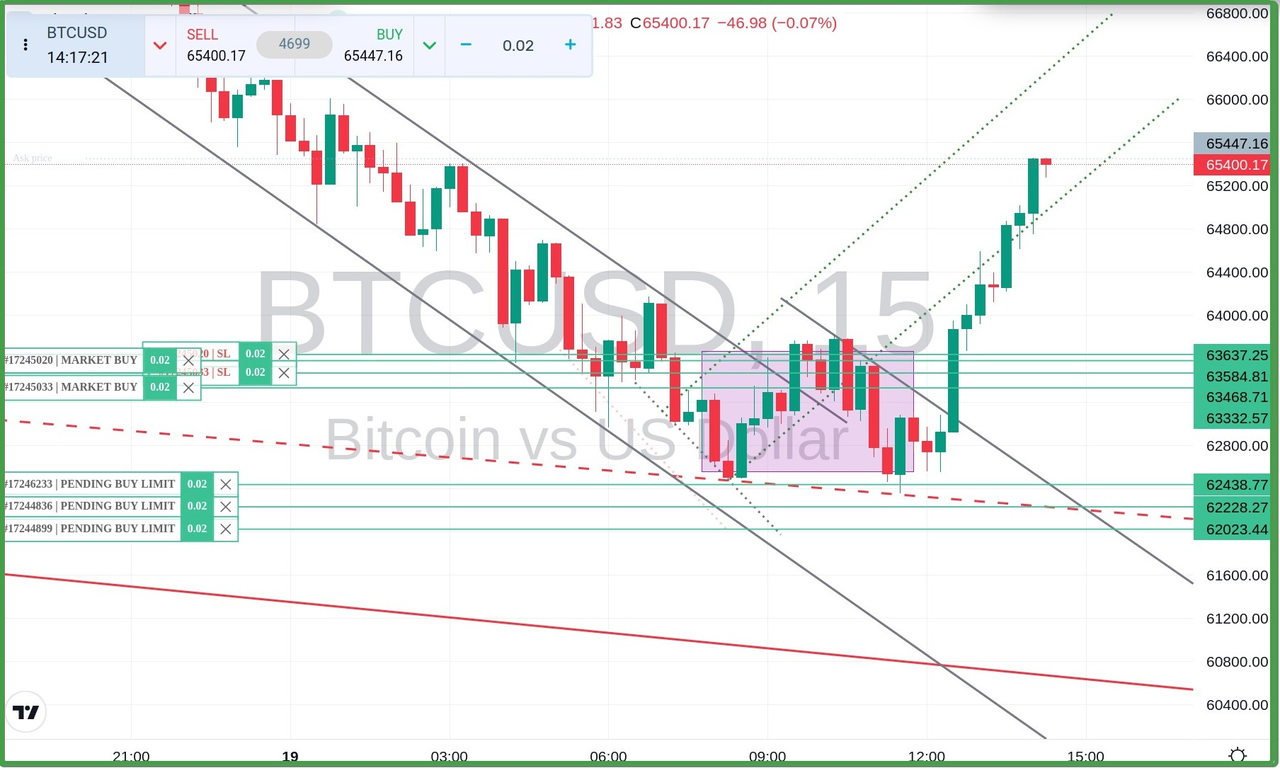
Here is what the price of Bitcoin is doing as I write this post. None of my positions are anywhere near going into losses, so that gives me a break and time to write this.
And now we're headed upward until...?
I wrote this post so that anyone could read it even if they have never traded any assets. I hope it was clear. If anyone wants to give it a try, the site I use lets you play with trading using a demo account with no requirement to deposit any money. Have a great afternoon!
Comments